Is there a demo of a dashboard implementation?
I am not looking for anything complex. Just the sort of thing you could knock up in anaything else in a couple of hours. Some headline calculations and a graph or two:

or
Is there a demo of a dashboard implementation?
I am not looking for anything complex. Just the sort of thing you could knock up in anaything else in a couple of hours. Some headline calculations and a graph or two:
Hello Douglas,
If you want to add some graphs in your pages, you can use the custom component “qodly_chart” by the following link: GitHub - metayoub/qodly_chart.
After downloading it, this is the way to import it in a Qodly project:
Click on the button “Upload Component”:
Select that compressed file:
After selecting the file, click on “Install Component”:
Once you receive the following green confirmation, click on “Reload”:
See the new components in the “custom” title of the panel “Components”:
You can drag and drop whatever you want from these types of graphs.
Hi @jdcryer, you might also be interested by this tutorial:

OK I see how to get the component but I am not clear how I build the data source and attach it to the chart?
I have looked at the docs on git hub but they do not really help me with how to do this in Qodly…
Okay, I can give you an example about “bar chart” with steps:
[{"x":"Value 1","y":10},{"x":"Value 2","y":25}]:You can customize the chart with changing its title or adding CSS styles.
This is another example with two bars (this time the initial value is: [{"x":"Value 1","source1":10,"source2":20},{"x":"Value 2","source1":25,"source2":40}]):
If you don’t want to add an initial value to the Qodly Source, in this case you need to create a function and return a collection.
A few new concepts for me there. So far I have not written a line of code in Qodly (no code ![]() )
)
Steps 1 and 2 - Create a Qodly source (array) and give it an initial value - How? Is there a tutorial for that?
Yes to use the chart component as it is now (we’re working on improving it) you have to write code.
You create a Qodly Source of Type Array, you don’t need to give it an initial value.
Then you call can a function after an event, that makes use of toCollection() to generate the array you need and return it to your qodly app, mapped to you Qodly Source.
I do not think we have a proper tutorial for this yet, but we can work on it.
Mathieu
Thank you Matheieu. Like I say I do not know how to:
In 4D terms I would create the data as:
var $es_product : cs.productSelection
var $e_product : cs.productEntity
var $vc_stock : Collection

$vc_stock:=New collection
$es_product:=ds.product.all().slice(0; 10)  //Get first 10 products for test
For each ($e_product; $es_product)
	$vt_productName:=Replace string($e_product.name; "\""; "")
	$vc_stock.push(New object("x"; $vt_productName; \
	"source1"; $e_product.product_stock.sum("inStock"); \
	"source2"; $e_product.product_stock.sum("demand")))
End for each
$vc_stock:=$vc_stock.orderBy("v1 desc")
Which would give me a collection which would be the array you are suggesting. But how would I cast that to a Qodly source and make it available for the interface to use?
I came up with the following in Qodly speak, it runs in the debugger but I don’t know what to do next:
var es_product : cs.productSelection
var e_product : cs.productEntity
var vc_stock : collection=newCollection()

es_product=ds.product.all().slice(0,10) //Get first 10 products for test
forEach (e_product, es_product)
	vc_stock.push(Newobject("x", e_product.name,\
	 "source1", e_product.stockSelection.sum("inStock"),\
	  "source2",e_product.stockSelection.sum("demand")))
End
vc_stock=vc_stock.orderBy("source1 desc")
qodly calls collections “arrays”. you can use that as a datasource.
Yes but how? Lets say I have that code in a method:
declare () -> vc_stock : collection
var es_product : cs.productSelection
var e_product : cs.productEntity

vc_stock=newCollection()
es_product=ds.product.all().slice(0,10) //Get first 10 products for test
forEach (e_product, es_product)
	vc_stock.push(Newobject("x", e_product.name,\
	 "inStock", e_product.stockSelection.sum("inStock"),\
	  "demand",e_product.stockSelection.sum("demand")))
End
vc_stock=vc_stock.orderBy("inStock desc")
That now returns my collection. Where in the world do I put that?
@jdcryer, you should create that function in a Class Store not in a method, because you need to call it (for example when onloading the page).
So to add a function event, there is a panel in the bottom of the page called “Contextual Panel”.
You can see “On Load” (make sure you are selecting the page not any component to visualize the event “On Load”). Select the 3rd action (add a function event), there you need to select a function created in a Class Store, and then the return of that function will be a Qodly Source (binded to the chart component) with type “array”.
Sorry I don’t really follow that. I would need an example to work through.
Call a function videos :


Useful Qodly resources…
Qodly tutorials :
4D Blog/Qodly :
4D Depot/Qodly Pro :
I followed one of those videos as far as it is possible:
When I go to select a function I ca see it but it will not let me select. I siget a no entry symbol showing.
Stumped again? I was on a call with 8 other developers doing a basic demo of Qodly and none of them could figure this out either.
@jdcryer , for the name of the function, did you add the keyword “exposed” in its beginning?
It could be the reason of the function not being selected or clickable.
OK Got it, finally. I had to change a few other things and use the return rather than the collection variable but I got it working:
So I moved on the idea that I have an object returned as the data source with a property as the collection for the stock graph. Because I would altimately have a page full of graphs and I do not want a function call for each. A refactor:
My function now looks like this:
Exposed Function getStockGraph () : object
	var es_product : cs.productSelection
	var e_product : cs.productEntity
	var vc_stock : collection
	var graphData : object

	graphData= newObject
	vc_stock=newCollection()
	es_product=ds.product.all().slice(0,10) //Get first 10 products for test
	forEach (e_product, es_product)
		vc_stock.push(Newobject("x", e_product.name,\
		 "inStock", e_product.stockSelection.sum("inStock"),\
		  "demand",e_product.stockSelection.sum("demand")))
	End

	graphData.stockGraph=newCollection
	graphData.stockGraph=vc_stock.orderBy("inStock desc")
	return graphData
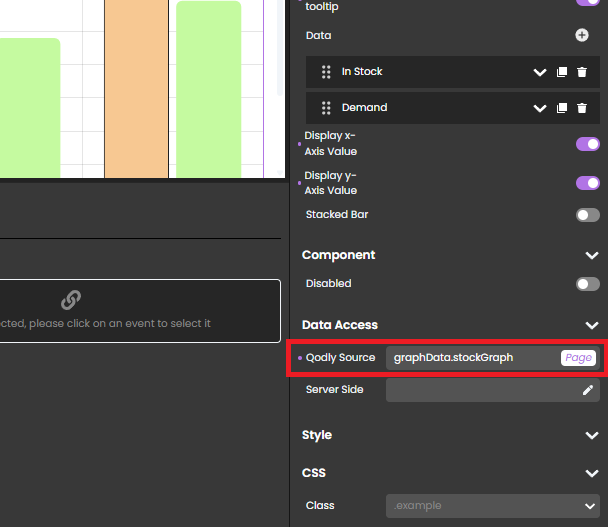
My source and onLoaded functions look like:
My binding to the graph looks like:
To make sure, I just did some reduced steps, is the error below returned on your side (if you preview from the studio not the renderer)?
Yes that is the same error when I run it for the page only.
So it is something I am doing wrong or something that does not work the way I expect?
After discussion, I think there is an issue (to fix) in the custom component “charts”.
We will see if we can fix it and let you know if yes.
Best regards.